Share of Voice SEO: A Practical Measurement Guide
Learn how share of voice SEO works, how to calculate it, and how to use intent-based metrics to assess search visibility and business impact.
Published 12 min read
In this article
- Table of Contents
- Why One Share of Voice Score Is Not Enough
- Understanding the Core Share of Voice Concept
- Comparing Share of Voice Calculation Methods
- Building a Repeatable SEO Measurement Process
- Reading a Shopify Search Visibility Example
- Measuring Visibility Beyond Traditional Rankings
- Turning Share of Voice Into SEO Decisions
- Making Better Share of Voice Decisions
A single share of voice percentage looks decisive in a report, and that's exactly why it misleads. It compresses rankings, clicks, search intent, and commercial value into one number, then invites a merchant to celebrate or panic without knowing what changed. A store doesn't need a louder score. It needs a measurement system that shows where visibility appears, whether shoppers act on it, and whether that activity supports sales.
Table of Contents
- Why One Share of Voice Score Is Not Enough
- Understanding the Core Share of Voice Concept
- Comparing Share of Voice Calculation Methods
- Building a Repeatable SEO Measurement Process
- Reading a Shopify Search Visibility Example
- Measuring Visibility Beyond Traditional Rankings
- Turning Share of Voice Into SEO Decisions
- Making Better Share of Voice Decisions
Why One Share of Voice Score Is Not Enough
Two Shopify stores can report the same visible ranking share and produce opposite commercial results. One store appears for product searches close to purchase. The other dominates broad informational queries that generate impressions but few product visits. A combined Share of Voice SEO score treats those outcomes as equivalent, even though the second store may be educating shoppers who later buy from a competitor.
The problem starts with the underlying measurements. Google Search Console separates impressions, clicks, click-through rate, and average position, and each metric answers a different question. Google notes that grouping choices can also change how the data reads, as explained in its guide to grouping Search Console performance data by property, page, and other dimensions. A ranking-based percentage strips away those distinctions.

The Question Behind the Score
The useful question isn't whether total share rose. It's which share matters for the store. A merchant selling replacement parts cares about high-intent, non-brand product queries in specific countries. A fashion retailer may value collection discovery differently. Without segments for intent, category, geography, device, and brand status, the headline score can't guide a decision.
Analyst rule: A rising visibility trend paired with falling clicks isn't success until the query mix, snippet quality, and search features explain the gap.
Visibility can increase while clicks fall. Search features may absorb attention, snippets may fail to earn the click, or new rankings may sit on low-intent topics. That's why share of voice works best as a measurement lens, not a universal success score. The three-layer approach that follows separates being present, earning visits, and influencing revenue, so each movement points to a different investigation rather than a generic verdict.
Understanding the Core Share of Voice Concept
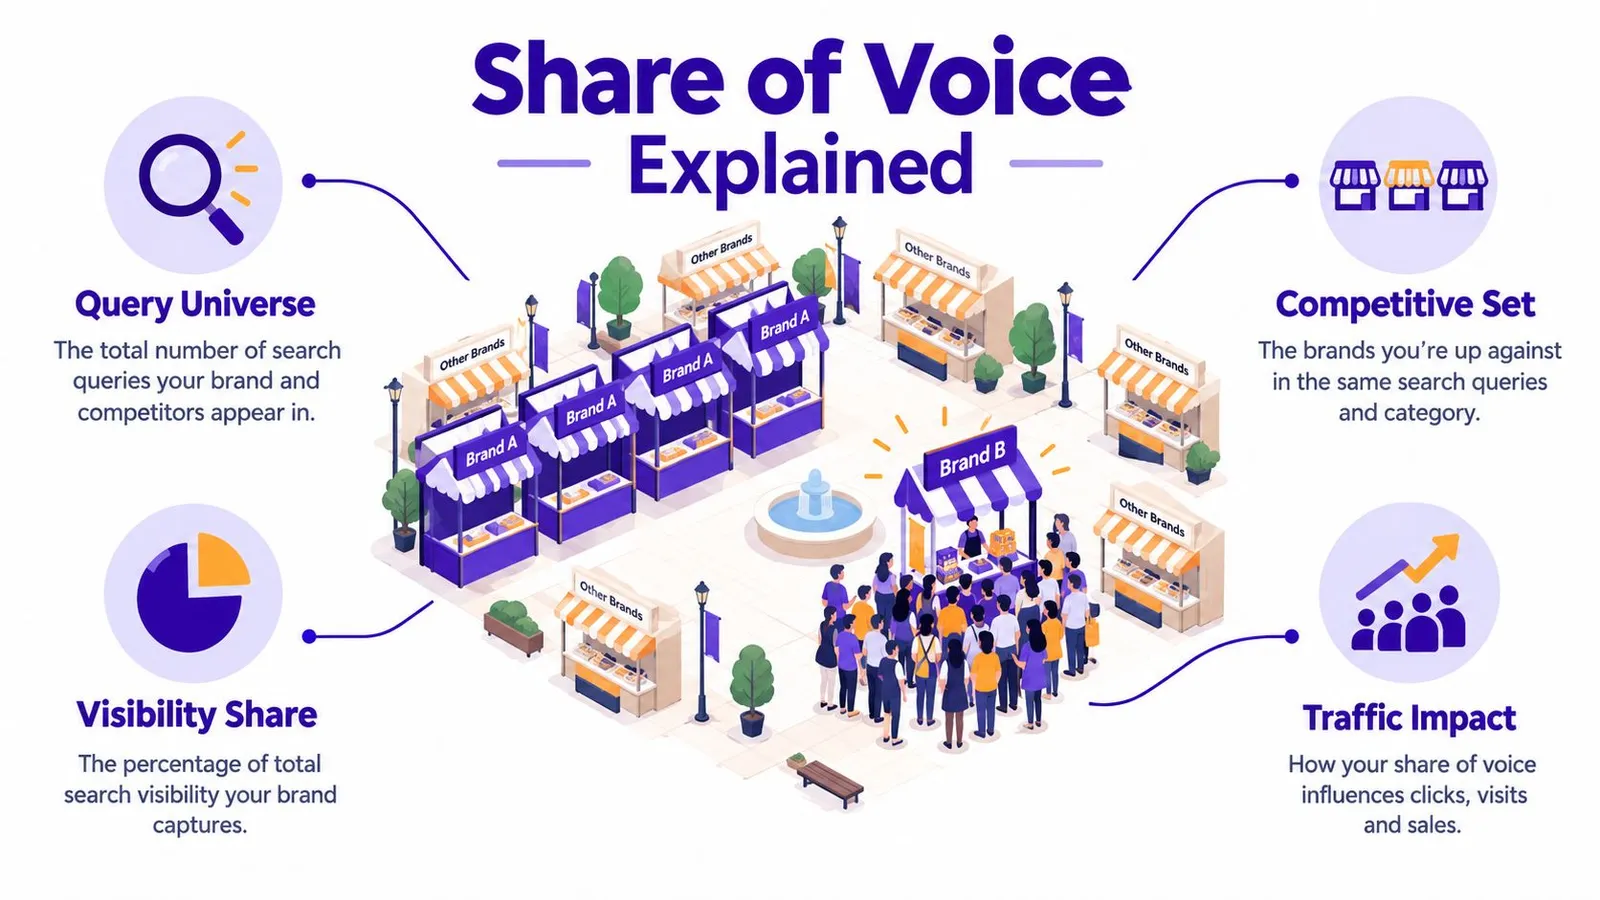
A marketplace makes the distinction easier to see. One brand rents several stalls across the square, so its signage appears everywhere. Another brand runs a single stall near the entrance shoppers use, and a queue forms there all day. The first brand owns more visible space. The second owns more buying attention. Counting stalls alone would crown the wrong winner.
Share of voice in SEO means the portion of a defined competitive search space where a domain, brand, or page appears relative to selected peers. Every word in that definition carries weight. The search space must be defined, the peers must be selected, and the appearance must be measured in a stated way. Change any of those choices and the result changes, even if rankings haven't moved at all.
Three Layers That Tell Different Stories
A defensible report separates at least three layers:
- Query-weighted visibility share: Presence across the tracked query set, weighted so strategically important searches count more than incidental ones.
- Click share: The portion of available organic clicks the store captures, which reflects snippet appeal and placement, not just presence.
- Business-outcome share: The portion of revenue, conversions, or assisted conversions linked to that search activity.
These layers routinely diverge. Visibility share can climb after a blog program expands into informational topics. Click share may stay flat if those pages rank below strong features. Business-outcome share may fall if competitors strengthen their hold on collection and product queries at the same time. Each layer is honest on its own terms. Problems start when a report uses one layer to claim what only another layer can prove.
Rank position isn't share of voice either. Position describes where one result sat for one query. Raw visibility counts appearances. Traffic share counts visits. Revenue describes outcomes. Share of Voice SEO sits above those inputs as a relative, competitive construct, and it only means something when its scope is stated.
For readers building the competitive set behind that scope, Wispra explique l'analyse concurrentielle offers a useful companion view on framing competitor analysis. The query universe itself should be built deliberately rather than scraped from a tool default, and the process in the guide to structured keyword research for a store content plan fits that planning stage. A merchant who can state the query set, the competitors, and the layer being reported already understands more than a dashboard percentage reveals.
Comparing Share of Voice Calculation Methods
There's no universally correct share of voice number because every formula hides editorial choices. The query list, the competitor set, the treatment of branded terms, and the weighting scheme all shape the output before any ranking data enters the calculation. Two tools can therefore disagree while both compute their chosen method correctly. The disagreement isn't an error. It's evidence that they're answering different questions.
Consider what happens when low-intent informational queries join the tracked set. A store with a large blog suddenly gains share because the denominator now includes topics it covers heavily. Remove branded searches and the same store may lose share, since brand terms usually favor the brand owner. Weight queries by category margin and the ranking of priorities shifts again. None of these versions is neutral. Each one encodes a view about what visibility is worth.
Method Comparison at a Glance
| Method | Core question | Primary input | Main limitation | Best use |
|---|---|---|---|---|
| Unweighted visibility share | How often does the store appear across tracked queries | Ranking presence per query | Treats trivial and valuable queries as equal | Quick coverage checks across a topic area |
| Rank-based share | How prominently does the store rank relative to peers | Positions converted into visibility points | Position is approximate and doesn't prove attention | Tracking competitive movement in a fixed query set |
| Click share | How much organic click activity does the store capture | Clicks or modeled clicks per query | Competitor clicks are usually estimated, not observed | Judging snippet performance and realized demand capture |
| Business-weighted share | How much commercially valuable visibility does the store hold | Queries weighted by revenue relevance or conversion value | Weights reflect judgment and need regular review | Prioritizing categories and content investment |
The table exposes a trade-off. Simpler methods are easier to reproduce but easier to misread. Weighted methods align better with commercial goals but depend on assumptions a reviewer must be able to inspect. A merchant without specialist staff should prefer a simple, documented method over an unexplained one nobody can explain in a meeting.
A percentage without its method label is an opinion wearing a number's clothing.
Symbolic examples keep the logic honest. If Store A appears on Queries 1 through 10 and Store B appears on Queries 8 through 12, their raw presence counts look close. If Queries 8 through 10 carry buying intent and Queries 1 through 7 are definitional, a weighted view favors Store B. The rankings didn't change. The question did.
The practical recommendation is strict labeling. Every reported score should carry its method, query scope, competitor set, market, device, and date range beside it. A score labeled that way can be challenged, reproduced, and improved. An unlabeled score can only be believed, and belief is a weak foundation for budget decisions.
Building a Repeatable SEO Measurement Process
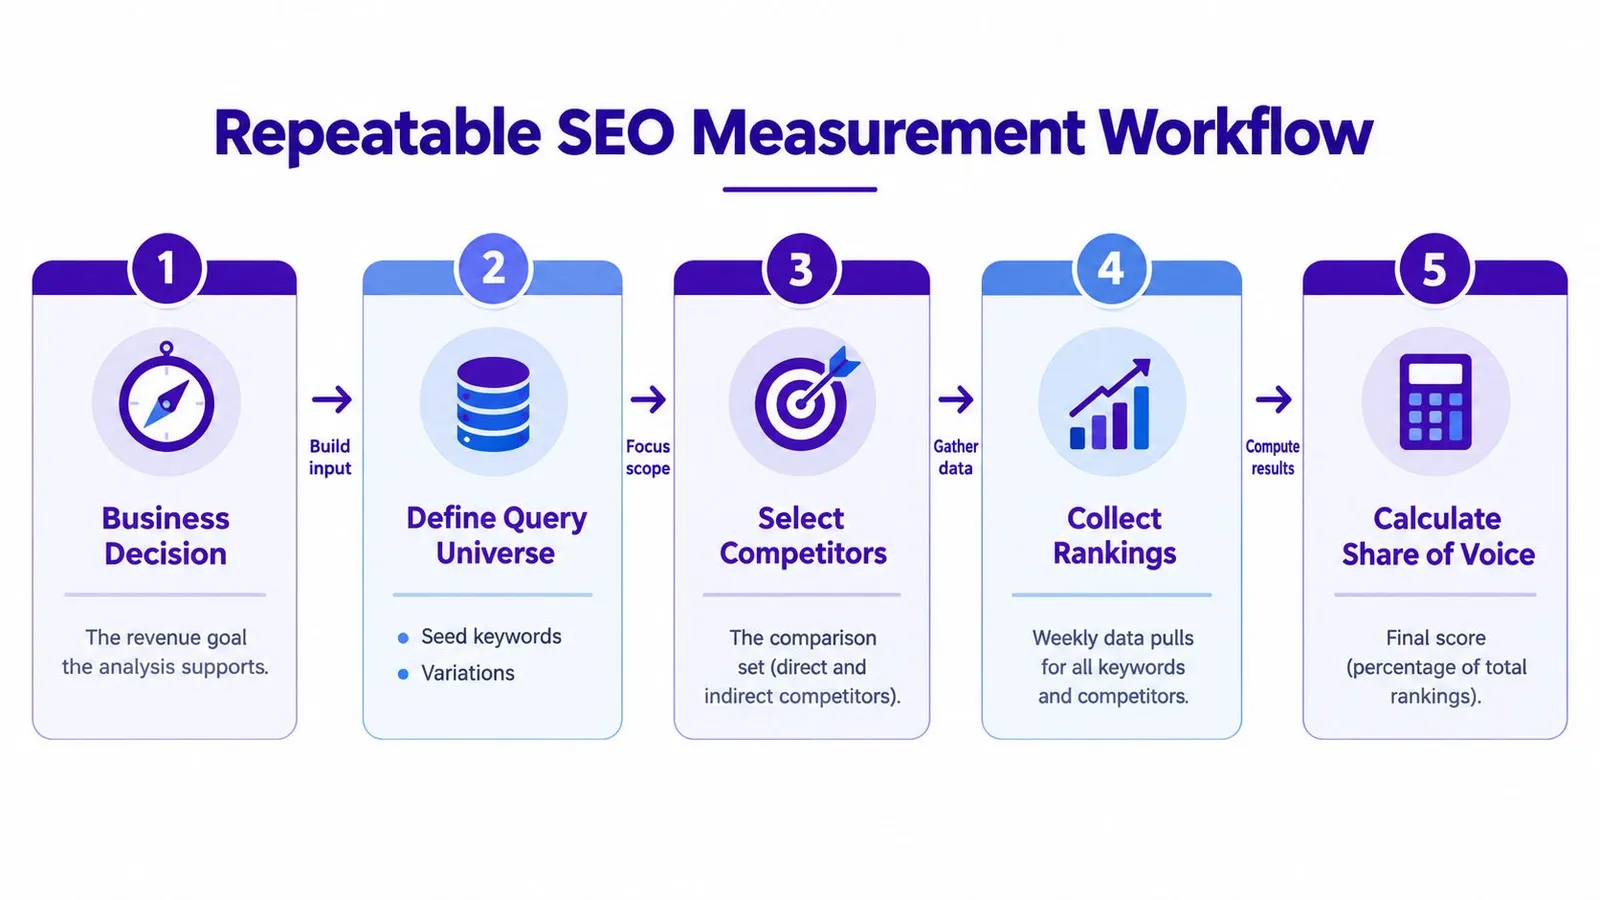
A repeatable process starts with the decision, not the data pull. A merchant deciding whether to expand content in a product category needs a different share of voice view than an agency auditing a domain migration. The workflow below maps that path from business question to documented score.
Defining Scope Before Collecting Data
The first working session should produce written answers to a short list of scope questions:
- Business decision: What will change if share rises or falls in this segment?
- Query universe: Which product, collection, informational, and comparison queries define the competitive space?
- Comparison set: Which direct rivals, marketplaces, and editorial sites compete for the same results?
- Boundaries: Which countries, languages, and devices count, and are branded queries included or reported separately?
- Time frame: What baseline period and comparison period will future reports reuse?
Scope decisions feel slow, but they prevent the most common reporting failure, which is comparing two periods that weren't measuring the same thing. A stable query universe also keeps content planning honest, since topics can be scheduled against known gaps using a system like the content calendar approach for planned store publishing rather than chased reactively each month.
Search Console supplies observed evidence for the store's own performance, including which queries and pages earned impressions and clicks. Competitor evidence comes from rank tracking and manual result inspection, and those sources carry estimation error. A credible process labels which figures are observed and which are modeled, then keeps them in separate columns instead of blending them into false precision.
The short walkthrough below shows how a measurement workflow moves from raw observations toward a documented share figure.
Weighting and Documentation
Intent and commercial value weights should be simple enough for a store operator to defend. Queries can be tagged as informational, commercial, or transactional, then weighted by category priority. The exact weights matter less than their consistency. Changing weights mid-quarter without restating the baseline destroys comparability, so any revision should trigger a recalculated history or a clearly marked break in the series.
The final artifact is a scorecard another analyst could reproduce. It stores the query list, tags, weights, competitor domains, data sources, and formulas in one place. When a stakeholder asks why share moved, the answer comes from the scorecard's segments rather than from guesswork. That reproducibility is what turns share of voice from a tool output into a management metric.
Reading a Shopify Search Visibility Example
Consider a hypothetical Shopify store selling home fragrance products. Over one quarter, its blog content about scent layering and candle care earns growing impressions. At the same time, competitors publish stronger collection pages for seasonal gift sets, and the store's product-oriented rankings slip. A single share of voice score blended across all queries might rise, stay flat, or fall depending on the formula, and none of those outcomes would explain what happened.
A layered reading tells a sharper story. The three scenarios below use the same underlying activity but support different conclusions:
- Visibility reading: The store appears more often overall, so a visibility layer suggests progress.
- Click reading: Informational pages attract modest click activity while product pages lose clicks, so click share weakens.
- Outcome reading: Gift-set revenue shifts toward competitors, so business-outcome share signals a commercial problem.
Segmentation Changes the Verdict
Splitting the query set exposes the mechanism. Informational queries improved. Commercial queries declined. Branded queries held steady because loyal customers still searched the store name directly. Non-brand transactional queries, the segment tied to new-customer revenue, deteriorated. A merchant reviewing only the blended score might fund more blog content. A merchant reviewing segments would instead inspect collection page relevance, internal routes from articles to gift sets, and the snippets competing for high-intent searches.
Interpretive caution: Rising impressions in a low-intent segment can mask a shrinking presence where purchase decisions happen.
The investigation then becomes concrete. Do candle care articles link to the relevant collections with descriptive anchors? Do collection pages answer the comparison questions shoppers ask before buying a gift set? Do titles and descriptions promise something the landing page delivers? For merchants working through those page-level fixes, guidance on how to optimize Shopify stores provides practical context for aligning product and collection pages with search demand.
This example stays illustrative on purpose. It doesn't claim benchmark performance for any real store. Its value lies in showing that interpretation depends on segmentation, and that a store can look healthier or weaker depending on which layer a report foregrounds. Analysts who present all three layers let decision makers see growth, leakage, and commercial risk at the same time.
Measuring Visibility Beyond Traditional Rankings
Traditional rankings describe one surface of search. Shoppers also encounter brands through shopping results, product-rich results, reviews, marketplaces, and AI-generated answers. A store can be summarized or cited in those places without receiving a conventional organic click, and a competitor can capture the eventual transaction through a surface the ranking report never inspected.
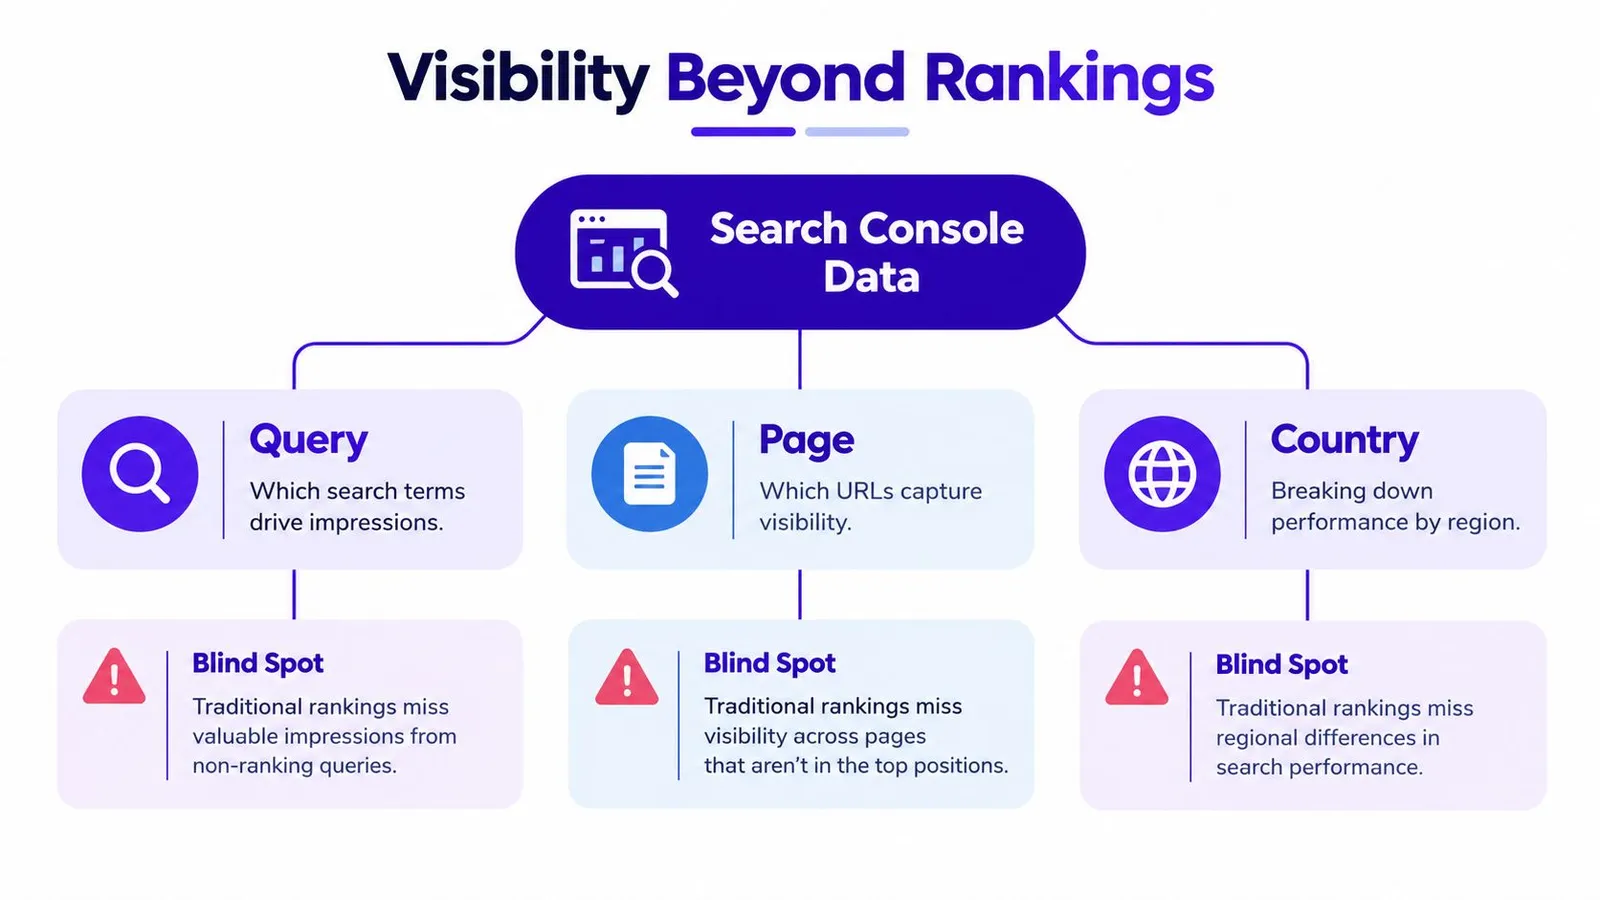
Search Console remains essential, but its limits should be stated plainly. Google documents performance data across dimensions such as query, page, country, and device, as described in its reference on performance report metrics and dimensions in Search Console. Those standard metrics don't fully represent visibility on every search surface or mentions inside AI answers. Treating them as complete visibility measurement overstates what the data can support.
Separating Observable Signals From Blind Spots
A stronger report tracks distinct indicators rather than forcing everything into one share figure:
- SERP-feature ownership: Which tracked queries show the store in shopping units, rich results, or other prominent features?
- Product-rich-result presence: Which products surface with price, availability, or review detail attached?
- Branded-query growth: Is navigational demand for the brand expanding in each market?
- Referral-assisted conversions: Which external mentions and review pages send shoppers who later buy?
- Observable AI-answer citations: Where do sampled AI answers cite or mention the store or its content?
Each indicator needs an honesty label. Search Console clicks are observed. Sampled AI citations are partial observations, since absence in a sample doesn't prove absence everywhere. Untracked marketplace influence is a blind spot. External authority still feeds several of these surfaces, which is why link evidence belongs in the wider diagnostic picture, as covered in the overview of backlink signals and external mentions for stores.
The nuanced implication matters for reporting tone. Falling clicks don't automatically prove falling visibility, because shoppers may encounter the brand in a feature or answer and arrive later through another route. Rising impressions don't prove stronger influence either. A diagnostic system with uncertainty labels protects a merchant from both overreactions, and it keeps the conversation focused on what evidence exists rather than what a dashboard implies.
Turning Share of Voice Into SEO Decisions
Measurement earns its cost when each layer triggers a different response. A reporting cadence works best when visibility, clicks, and outcomes are reviewed together but acted on separately. Blending them back into one verdict at the decision stage undoes the analytical work that produced them.
When query-weighted visibility rises, the first check is composition. Analysts should confirm which segments drove the gain and whether those segments match the store's commercial priorities. Growth concentrated in a strategic category supports continued investment. Growth concentrated in tangential topics may inflate the denominator with low-value coverage.
When click share falls while visibility holds, the investigation shifts to the results page itself. Snippet wording, competing features, price visibility in shopping units, and page titles all influence whether presence converts into visits. When business outcomes weaken despite stable clicks, landing page relevance and the route from article to product deserve scrutiny. Content may be attracting the right query but the wrong shopper, or sending the right shopper to a page that doesn't answer the buying question. The library of published articles and their product connections becomes evidence at that point, since internal links show whether informational readers can reach relevant collections.
A Short Verification Checklist
- Scope check: Did the query set, competitor list, or weights change during the period?
- Segment check: Do results hold by intent, category, country, device, and brand status?
- Page check: Does each gaining or losing query map to a relevant landing page?
- SERP check: What features and rival formats surround the store's listings?
- Outcome check: Do clicks in the segment produce conversions or assisted revenue?
Segmentation protects against the global average trap. A store can gain share in its home market while disappearing in an expansion market, and the blended figure will hide both facts. Decisions made at segment level, such as localizing a collection page or rebuilding internal links for one category, stay proportionate to the evidence. Not every increase deserves celebration, and not every decline demands a rebuild. The checklist forces that judgment before resources move.
Making Better Share of Voice Decisions
Share of voice becomes useful only when its scope, calculation, and evidence are explicit. Three judgments should stay separate in every review. First, is the store more visible within a strategically meaningful query set? Second, is it winning a proportionate share of clicks from that visibility? Third, do those signals support the intended business result?
Three actions keep those judgments grounded. Merchants should document the baseline scorecard, review layered metrics by segment on a fixed cadence, and investigate changes before declaring success or failure. Consistent execution matters as much as analysis, and a disciplined approach to publishing content against a documented plan keeps the query universe and the content program aligned. Treated that way, Share of Voice SEO stops being a vanity percentage and becomes a decision system a small team can trust.
Merchants who want that measurement discipline without adding a content team can use Rankira, an AI-powered SEO content application built for Shopify that researches keywords, generates articles with product and collection context, and publishes them directly to a store blog. Its scheduling, internal linking, and search performance reporting help a store act on the segments where visibility, clicks, and outcomes diverge. Visit Rankira to start building a content program measured by evidence rather than a single score.
Put your Shopify blog on autopilot
Rankira researches keywords, writes SEO articles, adds internal links, and publishes them to your store — every week. Start with a 7-day free trial.