Search Engine Optimization Metrics: What to Track
Find the search engine optimization metrics that matter for Shopify, from CTR and rankings to Core Web Vitals, and learn how to read them.
Published 15 min read
In this article
- Table of Contents
- Why Traffic Alone Misleads Store Owners
- The Core SEO Metrics at a Glance
- Reading Impressions, Clicks and Position Together
- Engagement and Conversion Metrics That Connect to Revenue
- Core Web Vitals Thresholds and What to Fix
- Backlink and Authority Metrics Worth Watching
- Measuring Zero-Click and AI Answer Visibility
- Build Your Monthly SEO Metrics Review
A Shopify merchant opens the analytics dashboard and finds that organic sessions have fallen since the previous month. The immediate worry is that Google has stopped showing the store, or that the latest batch of blog posts hasn't worked.
Then the merchant checks the other reports. Search impressions have increased, while a recent theme update has made product pages slower. The traffic decline is real, but the headline number doesn't explain the cause or identify the best fix.
Table of Contents
- Why Traffic Alone Misleads Store Owners
- The Core SEO Metrics at a Glance
- Reading Impressions, Clicks and Position Together
- Engagement and Conversion Metrics That Connect to Revenue
- Core Web Vitals Thresholds and What to Fix
- Backlink and Authority Metrics Worth Watching
- Measuring Zero-Click and AI Answer Visibility
- Build Your Monthly SEO Metrics Review
Why Traffic Alone Misleads Store Owners
Search engine optimization metrics work as a measurement system, not a single score. A store owner needs to distinguish exposure in search results from visits, buying activity, and technical problems. Otherwise, an encouraging graph can hide a commercial problem, while a disappointing graph can prompt unnecessary changes.
A car dashboard offers a useful comparison. The speedometer shows movement, but it doesn't show whether the engine is overheating or whether there's enough fuel to finish the journey. Organic sessions serve a similar purpose: they describe activity without explaining the condition of the whole system.
Different gauges answer different questions
A useful SEO report separates the questions a merchant needs to answer:
- Visibility: Is Google showing the store for searches relevant to its products?
- Acquisition: Are those appearances generating visits from potential customers?
- Commercial progress: Are visitors exploring merchandise, adding products to carts, and placing orders?
- Technical health: Can visitors load and use the pages without unnecessary friction?
In the opening scenario, rewriting every article would be premature. The merchant should investigate which landing pages lost sessions, whether their search queries changed, and whether the theme update affected visitors' ability to shop.
Keyword rankings alone wouldn't resolve that uncertainty. A store with a large product catalog can monitor a handful of popular terms while missing changes across collections, product variants, and informational articles. Those tracked keywords may look healthy even when important landing pages struggle.
Practical rule: A metric earns its place in a report when it helps identify a decision, not merely because a reporting tool displays it.
The most useful report connects visibility, qualified visits, commercial outcomes, technical experience, external authority, and discovery inside AI answers. That combination gives the merchant a starting point for investigation and a reason to choose a particular change.
The Core SEO Metrics at a Glance
| Metric | What it counts | Where to find it | Healthy direction |
|---|---|---|---|
| Impressions | Times a page appeared in Google results | Search Console Performance report | Rising for target queries |
| Clicks | Clicks from Google results to the store | Search Console Performance report | Rising alongside relevant impressions |
| CTR | Clicks divided by impressions | Calculated in Search Console | Improving for comparable, high-impression queries |
| Average position | Average position of the property's topmost result | Search Console Performance report | Moving closer to the top, with query mix checked |
| Organic sessions | Visits attributed to unpaid search | Google Analytics, usually GA4 | Rising for relevant product and collection landing pages |
| Organic conversion rate | Orders divided by organic sessions | Analytics or Shopify reports, using a consistent definition | Stable or rising as qualified traffic grows |
| Organic revenue | Sales attributed to organic visits | Shopify analytics or configured analytics reports | Rising without weakening commercial efficiency |
| Referring domains | Distinct external websites linking to the store | Ahrefs or a similar backlink tool | Growth from relevant, credible sites |
| Good Core Web Vitals share | Share of reported URLs with good status | Search Console Core Web Vitals report | Increasing across important templates |
Give each reporting tool a defined job
Google Search Console describes the store's presence in Google Search. It helps a merchant investigate queries, landing pages, devices, and countries. It isn't an order-management system, so its performance report shouldn't be expected to explain revenue on its own.
Google Analytics describes measured activity after visitors arrive. GA4 can help connect organic landing pages with product exploration and purchase events, provided the store's tracking is configured correctly. A merchant should confirm that purchase events represent completed orders rather than an earlier checkout action.
Shopify analytics supplies the store's commercial perspective. It helps merchants review orders and sales, while attribution settings determine how those results are assigned to acquisition channels.
The tools won't necessarily produce identical totals. They measure different events, use different attribution rules, and may lose different parts of a visitor's journey. Comparing trends within a consistent report is more useful than forcing every dashboard to reconcile perfectly.
Start with a manageable reporting set
A new store can begin with a compact dashboard:
- Search exposure and response: Impressions and clicks for commercially relevant pages.
- Buying outcomes: Organic conversion rate, with the purchase definition documented.
- Usability: The share of reported URLs with good Core Web Vitals.
The remaining metrics add diagnostic depth once these measures are being collected reliably. There isn't much value in a refined revenue calculation if purchase tracking is incomplete.
For stores that also handle consultations, trade accounts, or wholesale inquiries, Data Hunters Agency's guide can help connect search metrics to qualified leads. The useful distinction is between attracting an audience and attracting people who can become customers.
Reading Impressions, Clicks and Position Together
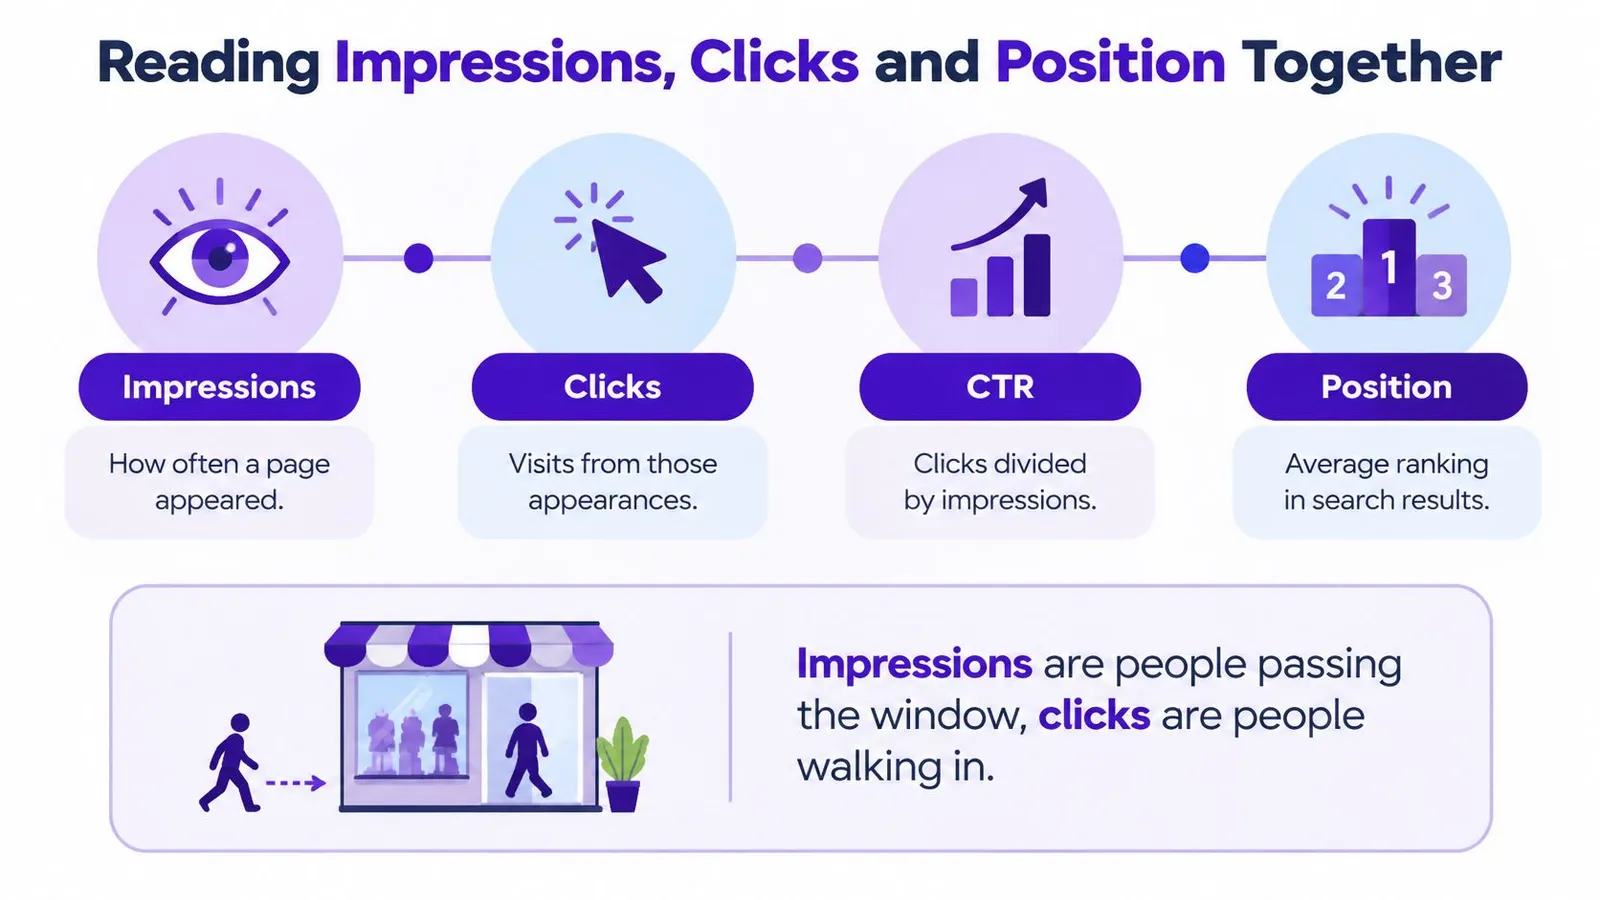
Impressions describe appearances, clicks describe responses, and CTR connects the two. According to Google's Search Console performance documentation, CTR is clicks divided by impressions, while average position reflects the property's topmost result rather than the average rank of every listing belonging to the site.
A shop window makes the relationship easier to picture. Impressions resemble people passing the window, while clicks resemble people walking through the door. The analogy explains the relationship, but it shouldn't be treated as proof that every recorded appearance received someone's attention.
The connected gauges can be pictured together:
Segment before diagnosing
A store-wide average mixes different kinds of searches. A product name, a broad buying guide, and a customer-service query don't represent the same opportunity.
The merchant should filter by URL, query, country, and device, then compare equivalent periods. Product and collection pages deserve separate views from informational articles, especially when the store publishes across markets.
Say a homewares collection starts appearing for broad decorating questions. Its impressions rise, but clicks remain flat because many searchers want inspiration rather than products. The first task is to inspect the new queries, not automatically replace a title that still performs well for buying searches.
Turn patterns into checks
| Pattern | Likely meaning | First action |
|---|---|---|
| Impressions up, clicks flat | Broader or less-relevant queries, or a weak title and description | Review the query list, then test a more relevant title and description |
| Clicks up, impressions down | More concentrated traffic from narrower visibility, not automatically an overall win | Confirm which queries remain and which disappeared |
| High impressions, positions near the first page, low CTR | Search demand with a possible snippet or intent mismatch | Review the actual results, then align the snippet and page with intent |
| Clicks, but no orders | The landing page or internal path may not support buying intent | Inspect product links, availability, and commercial relevance |
| Zero clicks, but GA4 shows organic visits | Canonical attribution or another measurement difference | Compare canonical URL groups before diagnosing a traffic failure |
A rising CTR can also conceal shrinking reach. If the store loses broad queries and retains mostly brand searches, the remaining audience may click more readily without representing new growth.
Click totals also need a consistent reporting level. Property-level aggregation and page-level reporting don't always count interactions identically, so summing URL rows shouldn't be assumed to reproduce every property total.
For a repeatable reporting approach, MyMentions explains how to track SEO performance with meaningful KPIs. A merchant investigating a particular term can also use this guide to checking rankings on Google rather than relying on an isolated personal search.
Position is diagnostic, not a business outcome. A change is most interpretable when the same query, market, device, and landing page are being compared.
Engagement and Conversion Metrics That Connect to Revenue
| Tier | What it establishes | Useful measures | Example question |
|---|---|---|---|
| Visibility | Relevant searches can surface the store | Query impressions and page visibility | Does the linen collection appear for linen bedding searches? |
| Qualified traffic | Searchers reach an appropriate destination | Non-branded clicks and relevant organic sessions | Are shoppers discovering the collection without already knowing the brand? |
| Engagement | Visitors move toward useful actions | Product views, add-to-cart activity, pages per session, engagement rate | Do guide readers explore the bedding products? |
| Commercial results | Organic discovery contributes to sales | Conversion rate, revenue per session, average order value | Does that activity produce worthwhile orders? |
The hierarchy resembles a funnel, but not every visitor travels straight through it. A shopper may read a care guide, return later through a brand search, and purchase after another visit.
That makes attribution a measurement convention rather than a complete record of influence. Google's explanation of Search Console reporting also notes that impressions can be counted without a listing being scrolled into view, and duplicate-URL clicks can be assigned to the canonical URL rather than the exact address visited.
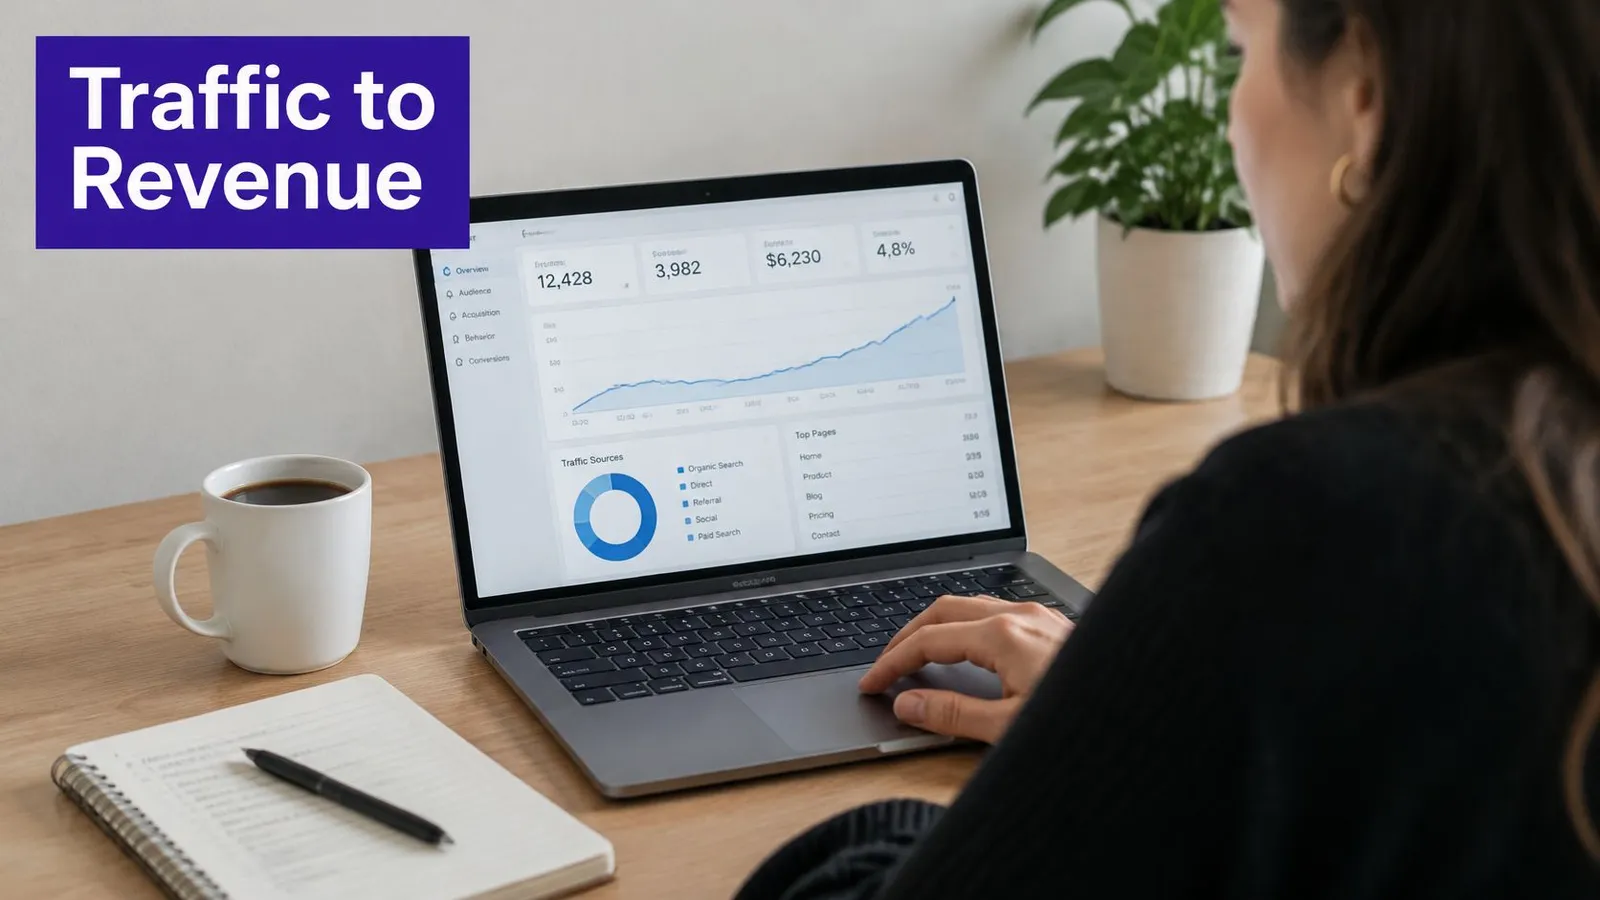
Commercial analysis therefore requires both search and on-site reports:
Separate discovery from existing demand
Branded queries contain the store's name or recognizable brand variations. Non-branded queries describe products, problems, or categories without naming the store.
A linen retailer should distinguish searches for its own name from searches for breathable summer bedding. The latter provides a clearer view of discovery beyond an existing audience, although neither category independently proves incremental sales.
Engagement then shows whether the destination supports the searcher's task. Product views per organic session can reveal whether visitors reach merchandise; add-to-cart rate shows movement toward checkout. Pages per session and engagement rate provide context, not universal targets.
A buying guide doesn't need to hold a reader indefinitely. A short visit followed by a product click can be useful progress. However, an internal product click shouldn't automatically be described as a bounce in GA4; event configuration and the session's measured activity matter.
Calculate outcomes consistently
For an order-based report, organic conversion rate uses orders divided by organic sessions. Revenue per organic session uses attributed organic revenue divided by those sessions, while average order value uses attributed revenue divided by attributed orders.
- Visits rise but product exploration falls: Inspect query relevance and the landing page's next step.
- Cart activity rises but purchases don't: Check shipping information, stock, checkout, and tracking.
- Orders rise but revenue efficiency weakens: Review the mix of products and discounts.
Revenue attribution is useful evidence, but it isn't a complete history of why someone bought.
Keeping the same attribution model over time makes comparisons more defensible. The hierarchy helps locate the first weak transition instead of blaming every commercial disappointment on rankings.
Core Web Vitals Thresholds and What to Fix
| Metric | Good | Needs improvement | Poor | What it measures |
|---|---|---|---|---|
| LCP | 2.5 seconds or less | Above 2.5 through 4 seconds | Above 4 seconds | Loading time of the largest visible element |
| INP | 200 milliseconds or less | Above 200 through 500 milliseconds | Above 500 milliseconds | Responsiveness across visitor interactions |
| CLS | 0.1 or less | Above 0.1 through 0.25 | Above 0.25 | Visual stability |
These boundaries use the 75th percentile of real-user experience, as described in Google's Core Web Vitals guidance. That means a quick test on a developer's laptop isn't enough to establish that actual visitors receive a good experience.
A merchant should begin in Search Console's Core Web Vitals report, identify URL groups marked poor, and determine which metric is responsible. A lab test can then help reproduce the mechanism behind the field-data problem.
Match the repair to the failing metric
LCP concerns the main visible content. On a product page, the likely candidate may be the main product image; on an article, it may be a hero image or large text block.
The developer should inspect the identified LCP element before changing unrelated assets. Useful fixes include:
- Image delivery: Resize and compress the main image for its display area, and avoid delaying its discovery.
- Rendering: Prioritize critical CSS and reduce resources that block the initial display.
- Response time: Investigate slow document delivery and unnecessary dependencies.
INP concerns interaction responsiveness. A page may look complete while reacting slowly to a filter, quantity selector, or add-to-cart action. Long JavaScript tasks and unnecessary third-party scripts are practical starting points.
The developer should inspect app scripts that run across the storefront, remove unused integrations, and break up expensive work where possible. A script deserves scrutiny when it delays shopping interactions without supporting a necessary feature.
CLS concerns unexpected movement. Images and embeds need reserved space, while banners, widgets, and late interface changes shouldn't push existing content around. A shopper trying to select a variant shouldn't find another control moving beneath the pointer.
Prioritize shared Shopify templates
A template-level defect deserves attention before an isolated cosmetic issue. If the product template loads an oversized image or an unnecessary widget, fixing the shared component can improve the affected group rather than just an individual page.
Testing should cover representative products, collections, and articles on mobile as well as desktop. A successful product-page repair doesn't establish that the collection filter or blog layout behaves properly.
The broader on-page optimization guide can help keep these technical changes aligned with page content and usability. Performance work shouldn't remove essential information or make product options harder to use merely to improve a test score.
Track the share of reported URLs with good status alongside organic clicks and conversions. Also record the affected URL count and template, because a changing reporting population can alter the share. Better technical experience is valuable, but it shouldn't be confused with proof that search demand or revenue has increased.
Backlink and Authority Metrics Worth Watching
Referring domains provide a more useful starting point than raw backlink totals. A sitewide footer can generate many links from the same website without representing independent endorsements from different publishers. Relevant editorial links deserve closer attention than an impressive total with little context.
Consider a hypothetical homewares store mentioned in a design magazine. The feature could introduce readers who are actively furnishing rooms and send them to an appropriate collection. A batch of unrelated directory listings might increase the backlink count without offering a comparable audience.
The example doesn't establish a guaranteed ranking benefit. It shows why the merchant should evaluate where a link appears, who might follow it, and whether the destination serves those readers.
Treat authority scores as estimates
Ahrefs Domain Rating is a third-party estimate of backlink-profile strength, not a Google metric or a direct measure of store quality. It can help compare link profiles, but it shouldn't become a substitute for qualified traffic or commercial results.
A merchant shouldn't pursue a higher score at the expense of relevance. A specialist publication with an appropriate readership may be more useful than an unrelated site with a stronger-looking tool score.
Review the links behind the total
A practical backlink review checks:
- Referring-domain changes: Inspect newly discovered and lost domains rather than recording only the net movement.
- Topical relevance: Determine whether the publisher and linking page have a credible connection to the store's products.
- Anchor-text variety: Review repeated commercial phrases, especially when they appear across unrelated sites without a natural editorial reason.
Repeated exact-match anchors warrant investigation, but a pattern alone doesn't prove a penalty or justify indiscriminate link removal. Context matters more than a simplistic label.
A sudden loss after a migration may indicate broken destinations, deleted collections, or changed URLs. The merchant should verify the old addresses, check whether the links still exist, and redirect retired pages to the closest relevant replacement where appropriate.
A backlink report should explain which relationships are useful, which destinations are broken, and which changes require action.
A structured competitive backlink analysis can reveal relevant publications and category resources that deserve investigation. The priority remains quality first, count second, with referral visits and useful customer activity providing additional context.
Measuring Zero-Click and AI Answer Visibility
A missing click doesn't always mean missing exposure. A shopper can encounter a brand in an answer, remember its recommendation, and search for it later. Like a billboard, that appearance may influence a decision without creating an immediate website visit.
A 2026 analysis summarized by Analytify's SEO statistics guide estimated that 68.01% of U.S. Google searches ended without an open-web click. That broad estimate isn't a store-specific benchmark, but it illustrates why click-based reporting alone can't describe every discovery opportunity.
For a merchant, the practical question is whether that exposure produces recognizable downstream value:

Keep coverage separate from click behavior
AI-summary coverage means whether an AI summary appears for a monitored query. Zero-click behavior concerns whether a search ends without a click. An answer can appear and still generate visits, so these measures aren't interchangeable.
The store also needs to distinguish a brand mention from a citation. A mention names the business or product; a citation identifies a source, potentially including a clickable URL.
A manageable monitoring sheet can record:
- Search conditions: Query, country, language, device, and observation date.
- Answer presence: Whether a summary appears and which brands it mentions.
- Source inclusion: Whether the store is cited and which URL receives the citation.
- Business context: Changes in relevant clicks, branded searches, and commercial activity.
For repeatable spot checks, AI Tool Seekers offers a way to assess visibility in AI search. Any tool output should be interpreted within its tested prompts and conditions, not as complete coverage of every customer's experience.
Maintain a repeatable observation routine
The merchant should keep a stable list of priority buying and informational queries, check them monthly under consistent market and language settings, and record results in the same format. Repeated observations are more useful than treating an isolated answer as permanent.
This video provides an additional reference alongside the monitoring routine:
Search-layout changes belong in the reporting timeline. If an answer interface or shopping feature appears, a CTR decline shouldn't automatically trigger a content rewrite.
A share-of-voice SEO framework can also help compare the store with competitors across a defined query set. Rising branded searches may support a visibility hypothesis, but advertising, promotions, and other activity can contribute too.
Fewer clicks don't necessarily mean less value. Equally, mentions without brand or commercial impact aren't enough to establish success.
Build Your Monthly SEO Metrics Review
A monthly review should finish with an assigned action, a reason for that action, and a review date. The report doesn't need to resolve every uncertainty; it needs to separate evidence from assumptions and identify the most useful next investigation.
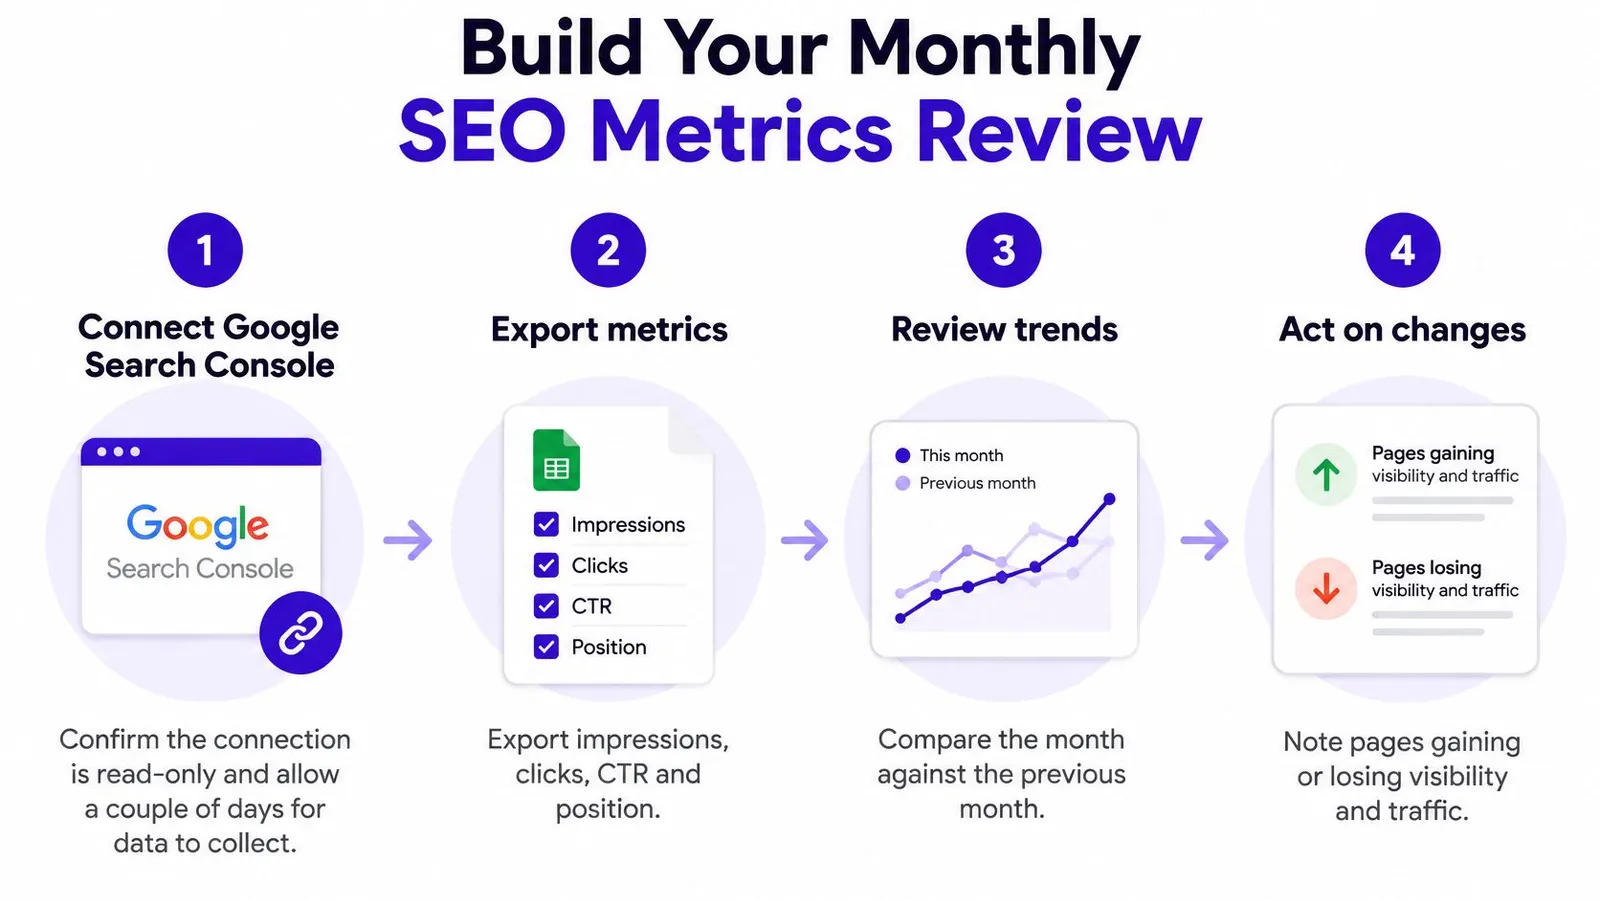
A repeatable routine keeps the work manageable:
Connect Search Console and confirm access. Rankira's connection links the merchant's Google account so it can read search performance; it's read-only, can be disconnected at any time, and requires a couple of days after connection to collect data.
Export comparable search views. Pull impressions, clicks, CTR, and position for pages and queries, segmented by country and device, using equivalent complete periods so unequal windows don't distort the comparison.
Review commercially important landing pages. Examine high-impression pages alongside pages associated with sales, because the biggest visibility opportunity and the most important revenue risk may sit in different places.
Log a template-level technical task. Inspect poor Core Web Vitals groups and assign a specific mechanism to investigate, such as a delayed main image or an unresponsive collection filter.
Read the commercial measures in sequence. Review organic sessions, product exploration, conversion rate, and revenue together to locate the point where visitors stop progressing.
Annotate changes outside SEO content. Record theme releases, search-layout observations, product launches, pricing changes, promotions, and tracking updates so later comparisons have context.
Choose a focused change and review date. Assign an owner to a title test, internal-link improvement, template repair, or measurement correction, with a clear description of the expected signal.
The simplified process is useful as a recurring reminder:
Keep the reporting record consistent
A reusable SEO report template should include the reporting period, filters, attribution model, observations, and chosen actions. That record makes it easier for a merchant or agency to distinguish an actual performance change from a changed report setting.
Rankira can keep search-performance views inside Shopify administration, while order and revenue analysis still belongs in the appropriate commerce and analytics reports. The routine works with other reporting tools too.
Rankira recommends two to three months of consistent publishing before judging results, because SEO compounds slowly. That isn't a reason to postpone checking broken tracking or unusable pages, and it isn't a guarantee of growth.
The store owner should schedule the first review this week, document the current baseline, and leave the meeting with a specific action and a review date.
Rankira researches keywords around a store's products, writes SEO-optimized articles, and publishes them automatically to the Shopify blog. Merchants seeking a connected content and measurement workflow can visit Rankira to explore its Shopify publishing tools and Search Console reporting.
Keep reading
All articles
Shopify SEO
Meta Tags Keywords: Why They No Longer Rank
Meta tags keywords do not affect Google rankings. Learn which metadata still matters and how to write titles and descriptions in 2026.
12 min read

Shopify SEO
Compare SEO Software for Shopify: Features and Fit
Compare SEO software by capabilities, data accuracy, workflow and cost, with Shopify fit for merchants, agencies and international teams.
13 min read

Shopify SEO
Keyword Research Services Compared: 10 Options for 2026
Compare 10 keyword research services by price, deliverables, and best-fit use case. Selection criteria, limitations, and when a Shopify-native option fits.
13 min read
Put your Shopify blog on autopilot
Rankira researches keywords, writes SEO articles, adds internal links, and publishes them to your store — every week. Start with a 7-day free trial.